Forums › Forums › Farktography General Chat › This week’s contest › 12-08-10 – Optimus Prime
- This topic has 152 replies, 24 voices, and was last updated 13 years, 4 months ago by
 orionid.
-
AuthorPosts
-
December 12, 2010 at 3:53 pm #35509
Curious
Participantorionid: Very interesting. I suspect you’re right. Jack and Suzy see a theme they’ve got the perfect picture for and enter it, then let their friends and family know about it, who then end up voting for others as well. They then disappear into the sunset until the next perfect theme comes along. Or as the data seems to indicate, most of them disappear forever. I’ve got 5596 unique entrants in my database and only 411 of those have entered more than 10 contests and 3211 (57%) have entered only one.
interesting supposition but it presupposes that Jack & Suzy’s assorted friends and family have fark accounts. in my personal experience my family (a sister) doesn’t. she merely looks because i send her a link. OTOH among my few RL and online friends 3 have fark accounts. and all enter at least occasionally. they lack my enthusiasm for entering regularly but match your “oh i have a picture for this” group.
basically i agree with you and orionid that some themes bring out more casual entries and therefore votes but wonder how many extra non participating voters that produces. in other words do Jack and Suzy’s family/friends really contribute significantly to the voting totals.
and since i don’t (usually) vote for mine what does a 4 vote total tell me about a particular entry 🙂
December 12, 2010 at 9:24 pm #35380U-Man
Participant1- Hey Kashari – these made me think of you – http://photo.net/photodb/member-photos?photo_id=11769932
2 – Congrats Elsinore. How did shooting Santa go?
3 – Why is envotiation still going?
December 12, 2010 at 9:46 pm #35510 orionidParticipant
3 – Why is envotiation still going?
So I can get 8 more votes from the really late-comers and make my average.
December 13, 2010 at 12:16 am #35511Elsinore
KeymasterThanks, guys 🙂
2 – Congrats Elsinore. How did shooting Santa go?
Thanks 🙂
Santa photos went pretty well, thanks for asking. Won’t win any portraiture awards, but I’ve seen worse lighting, and there were a few that I was really excited I captured–kids whose parents knew they were going to scream as soon as they stepped away, so I prefocused and shot right as mom was stepping away before the kid could cry, or the developmentally disabled girl in the wheel chair that I caught smiling as soon as she looked my way (with the help of some jingle bells keeping her attention).
3 – Why is envotiation still going?
Because the threads close at a random time, and apparently this week was super late by chance. It’s the latest I’ve ever seen a thread close, actually. They’re typically closed by noon Sunday, and usually well before that, but I’d seen as late as 1 or 2pm. Think I’ve seen them closed as early as 7am Sunday, but I’m not typically awake then, so I don’t have much of a dataset there.
December 13, 2010 at 12:22 am #35512CauseISaidSo
ParticipantI’ve only got this level of data for the last 7 contests, but 5 of those closed within 7:45-8:15, one at 9:15 and then this one at 4:30pm (all times in Fark server time).
December 13, 2010 at 12:44 am #35513EdenLiesObscured
ParticipantBlimey, it is a quiet one this week. I just cast my votes and was amazed to see how few votes some really great pictures had garnered.
Lowest. Voting. Evah?EdenLiesObscured
I love the picture of your boxer bouncing off the tree. Is she (?) always that barmy?thanks. and, yes, she is a wild, crazy one. dumb and hyper.
December 13, 2010 at 3:04 am #35514ParticipantBasically, I figured the overall vote drive is driven by the number of casuals, and the way to find any truth in that would be by creating an algorithm as such…
Edited to add: I screwed up the calculation of casual entrants in this post, so please disregard all statements about casual entrant counts and relationships to votes. All figures quoted as casual entrant counts are actually regular entrant counts.
Dangit, orionid, you got my interest up so I had to go run some numbers. Turns out the data doesn’t support this theory, at least not strongly.
Those with mathphobia may want to skip to the next post…
I only used data from the last 3 years (1/2/2008 – 12/8/2010) to exclude some of the wilder swings seen during the frontier times. I used your criterion for “casual entrant” – someone who’s entering this contest but has entered less than 8 of the previous 15.
I ran a correlation calculation on the various variables against the vote counts. (For those not familiar with correlation, it’s a measure of how closely one dataset is tied to another. A correlation of 1 means the datasets are tightly bound together – a 10% rise in one variable should yield a 10% rise in the other. A correlation of -1 is a perfect inverse relationship where the second variable falls when the first rises.)
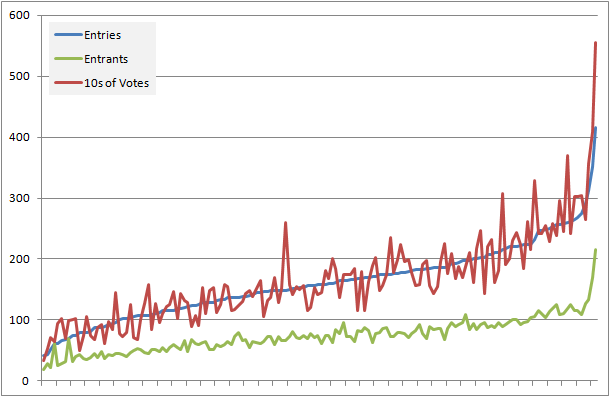
The strongest correlations are those that are intuitively obvious. The correlation of total number of entrants to total contest votes is 0.87, total entries to total votes is 0.91 and total entrants to total entries is 0.96. You can see that relationship in this graph:
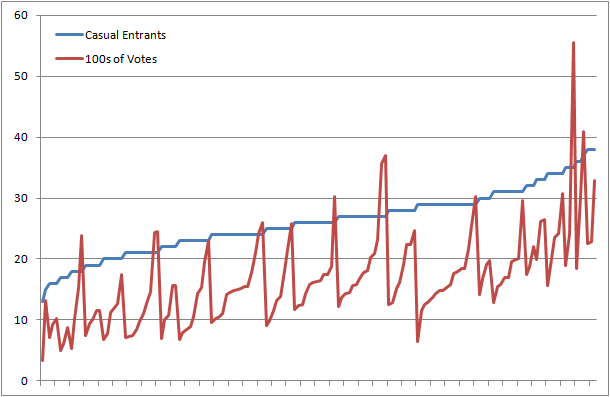
But the correlation of casual entrants to votes is only 0.60. You can see in this graph that the vote count swings wildly even with the same casual entrant count:
Surprisingly, the correlation of casual entrants to number of entries is even weaker at 0.57. It seems to suggest that the theme itself has more to do with it as it encourages more entries from even the regulars and more entries equals more votes.
December 13, 2010 at 3:22 am #35515Participantthanks. and, yes, she is a wild, crazy one. dumb and hyper.
I had two doggies (both are gone now) and one was smart and one was the dumb athlete. The dumb one would bark and paw at the floor if a ball went behind the couch. The smart one would simply walk around to the other side and get it. 🙂
December 13, 2010 at 3:47 am #35516ravnostic
ParticipantThose with mathphobia may want to skip to the next post…
…Dude~~that was harsh! But I got a nice buzz goin’ on…
I ran a correlation calculation on the various variables against the vote counts. (For those not familiar with correlation, it’s a measure of how closely one dataset is tied to another. A correlation of 1 means the datasets are tightly bound together – a 10% rise in one variable should yield a 10% rise in the other. A correlation of -1 is a perfect inverse relationship where the second variable falls when the first rises.)
//Just repeating with different spacing; in the original post the negative sign got separated from the second 1 and it was confuzusing. 😀 Lord help the mathly inepted.
The voting graph is very interesting. Mostly, it’s an initial rise, then a period of steady-held interest, then a big plateau with a major climax, then a sudden fail. From there it has to recharge until something perks interest again.
//That’s what she said.
Recently, it’s been up and down, up and down. It’s either hit or miss. I wonder why the change?
December 13, 2010 at 3:56 am #35517ParticipantThe voting graph is very interesting. Mostly, it’s an initial rise, then a period of steady-held interest, then a big plateau with a major climax, then a sudden fail. From there it has to recharge until something perks interest again.
Took me a minute to understand what you’re looking at, but I see it now – you’re talking about the second graph and how the vote counts change for a given casual entrant count, right?
If so, you can’t really read anything from the shape of that graph as it’s sorted not chronologically, but first by casual entrant count and then by votes, which gives the drop-to-minimum, rise-to-maximum shape for each casual entrant count. I did that to give the casual entrant count a smooth shape so it’s more easily compared agsint the vote count. Otherwise, if sorted by contest date, both datasets are wildly varying (as you’ve observed) and it’s more difficult to see the slight correlation they have.
December 13, 2010 at 4:04 am #35518Participantyou can’t really read anything from the shape of that graph as it’s sorted not chronologically, but first by casual entrant count and then by votes, which gives the drop-to-minimum, rise-to-maximum shape for each casual entrant count.
Oh. 😕 So there’s no real trend there. 🙁 Hmph. You just had to go and kill my buzz… 😆
December 13, 2010 at 10:33 am #35519ennuipoet
Participant
I just wanted to say this looks like a wildly erratic ECG. That is all. 😀
December 13, 2010 at 7:38 pm #35520kashari
Participant1- Hey Kashari – these made me think of you – http://photo.net/photodb/member-photos?photo_id=11769932
Wow, those are awesome, thanks for the link U-Man! I wish I had more frequent access to horses out in scenic places. Or, even better, that I had my own again…Kashari was the name of my Appaloosa I had when I was younger.
btw…I LOVED your kitty pics that you linked. What did you use as your background, do you have a studio setup kind of thing?
December 13, 2010 at 11:12 pm #35521Kestrana
ParticipantI kind of have to stifle a laugh at the hypothesizing going on about voting correlation re: casual participants. To me it seemed perfectly obvious that themes with higher numbers of casual participants will garner higher numbers of total votes because if the theme generates more casual interest participants it will generate more casual interest viewers as well. Judging from how many of my and orionid‘s friends/family view the thread every week and DON’T vote, I suspect the Jack and Suzy calling up friend x,y, and z to vote for them is a pretty rare occurrence. Since you have the ability to graph by total votes, it would be most interesting to me to see a link to the total votes by contest and draw whatever general consensus we can about the similarities in those themes if we want to generate more themes with high participation.
Although December is always a huge fall-off month for participation and voting so no need to panic over this week’s total votes imho.
December 14, 2010 at 3:32 am #35522ParticipantI kind of have to stifle a laugh at the hypothesizing going on about voting correlation re: casual participants. To me it seemed perfectly obvious that themes with higher numbers of casual participants will garner higher numbers of total votes because if the theme generates more casual interest participants it will generate more casual interest viewers as well.
Hey, your husband started it! 🙂
But I screwed up in my previous post so it turns out you’re mostly right (as indeed should’ve been obvious). The figures I used as casual entrants are actually the regular entrant counts – those that entered 8 or more of the past 15 contests. So, the correlation between regular entrants and total votes is 0.60. The correlation between total casual entrants and total votes is 0.82, a much stronger relationship.
My suspicion is that the threads with a higher ratio of casuals to regulars than the average thread are the ones that coincide with higher vote totals.
I neglected this part of your hypothesis so I ran those numbers (and this time I think I’ve got it correct). It turns out that although the total count of casual entrants affects the total vote count somewhat strongly, the actual percentage of casual entrants does so less strongly. The correlation of percentage of casual entrants to total votes is 0.54.
I think the only thing we can safely deduce from any of this is that more entrants equals more entries which equals more votes. Which is kind of a “no duh!” statement.
But orionid‘s other idea about a “wall of win” got me thinking that there are two ways to measure the “success” of contest – total votes, sure, but also votes/entry. I think votes/entry may better indicate viewer interest as opposed to participation rate.
So I ran another set of correlation calculations for votes/entry and basically there’s nothing really to predict that (aside from the theme itself). The number of entries has absolutely no correlation to votes/entry (0.01). The strongest correlation is for percentage of casual entrants, but it’s a weak negative relationship at -0.27! So, a higher percentage of casual entrants in general somewhat equals a lower vote/entry.
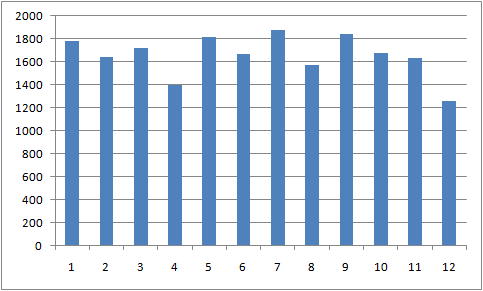
Although December is always a huge fall-off month for participation and voting so no need to panic over this week’s total votes imho.
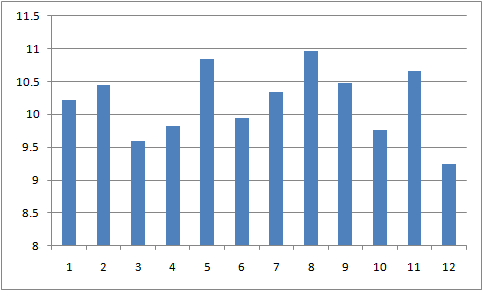
You’re right there (again). December not only produces a lower total vote count:
but it also produces a much lower average vote/entry:
And finally, for those of you still reading this, as kestrana suggested, here are the top ten themes that garnered the most votes over the past 3 years:
Date        Theme                                   Votes


2008-07-30  I Tawt I Taw A Puddytat                  5546

2008-06-04  Trees                                    4092

2010-01-20  Sunrise. Sunset.                         3691

2008-03-19  Nature Photography                       3559

2008-07-23  Farktography Classic: Blue II            3282

2010-09-22  Farktography Classic: Green 2            3067

2010-10-20  Travel Photography                       3047

2009-10-07  Farktography Classic: Black and White 2  3031

2010-01-06  Animals                                  3024

2009-05-27  Birds                                    2955
and here are the top ten in terms of viewer interest as indicated by votes/entry:
Date       Theme                                             Votes/Entry


2009-06-10 Tilt-Shift Faked Miniature Scenes                       17.38

2009-03-18 Tableau                                                 15.44

2009-08-26 Training Documents                                      15.41

2009-12-02 Win, Fail, or "I Like Where This Thread is Going"       15.10

2010-12-01 The Song Remains The Same                               14.80

2010-01-20 Sunrise. Sunset.                                        14.20

2010-09-22 Farktography Classic: Green 2                           14.20

2008-07-23 Farktography Classic: Blue II                           14.15

2009-01-21 Take Three                                              14.14

2009-04-29 Farkstronomy 13.80 -
AuthorPosts
- The topic ‘12-08-10 – Optimus Prime’ is closed to new replies.